A histogram is a graph of how many pixels in your photo sit at each brightness level, from black on one side to white on the other. Learning how to read a histogram for portrait photography takes about ten minutes of practice, and it is the fastest way to catch a blown cheekbone or a crushed hair shadow before you ever open the file.
The graph does not judge your photo. It just tells you where your tones landed, and in portrait work that matters because skin is the one thing you cannot get back once it clips. Below is the working method I use: set the exposure, check both edges, find where the face sits, then judge the spread against the look you planned.
One quick definition for anyone who wants the short version. A camera measures every pixel in the frame and counts how many sit at each of 256 brightness levels. Taller spike, more of your subject at that tone. A spike piled against either outer edge means data has been clipped and is gone for good.
Table of Contents
- What You Need
- Step-by-Step: How to Read a Histogram for Portrait Photography
- Common Mistakes
- Frequently Asked Questions
- What should a histogram look like for portrait photography?
- Does a histogram spike on the right mean my portrait is overexposed?
- Should I aim for a centered histogram when taking portraits?
- Is a histogram more accurate than the camera exposure meter?
- Why does my histogram look different from the histogram in Lightroom?
- How do I use a histogram without losing detail in skin tones?
- Conclusion
What You Need
Almost any camera from the last fifteen years will do. The histogram lives in the live view screen or the playback display, and you switch it on from a menu rather than a button, so expect ten minutes of menu hunting the first time.
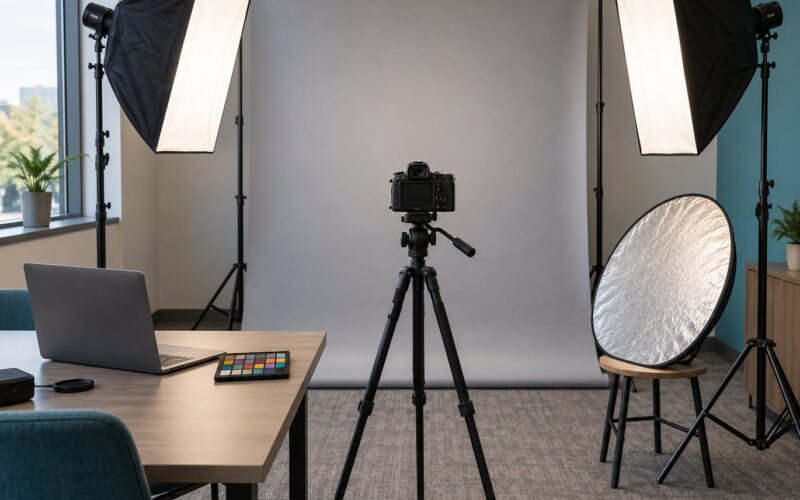
You need three things working together: the histogram display itself, the exposure readouts (shutter speed, aperture, ISO) so you know what you are adjusting, and a repeatable setup where the light on the face does not change between shots. Without that third piece, every frame looks different and the graph tells you nothing useful.
There are three flavours of the graph, and they answer different questions.
- Luminance histogram shows overall brightness with no colour information. This is the one to learn first, and the one you will use for every portrait.
- RGB histogram overlays the red, green and blue channels separately. It is a second opinion, useful when coloured light hits skin or a coloured background throws one channel past its limit while the luminance graph still looks fine.
- Phone histogram apps read the JPEG your phone processes, so they show you the finished render rather than the sensor data. Plenty good for a rough check, but the clipping they show is already baked in.
Turn off auto brightness on the rear screen if your camera has it, or at least know it is on. A dimmable LCD is exactly why photographers get fooled indoors: the graph does not change with the screen, the screen changes with the room.
Step-by-Step: How to Read a Histogram for Portrait Photography
Step 1: Turn On the Histogram and Learn the Axes
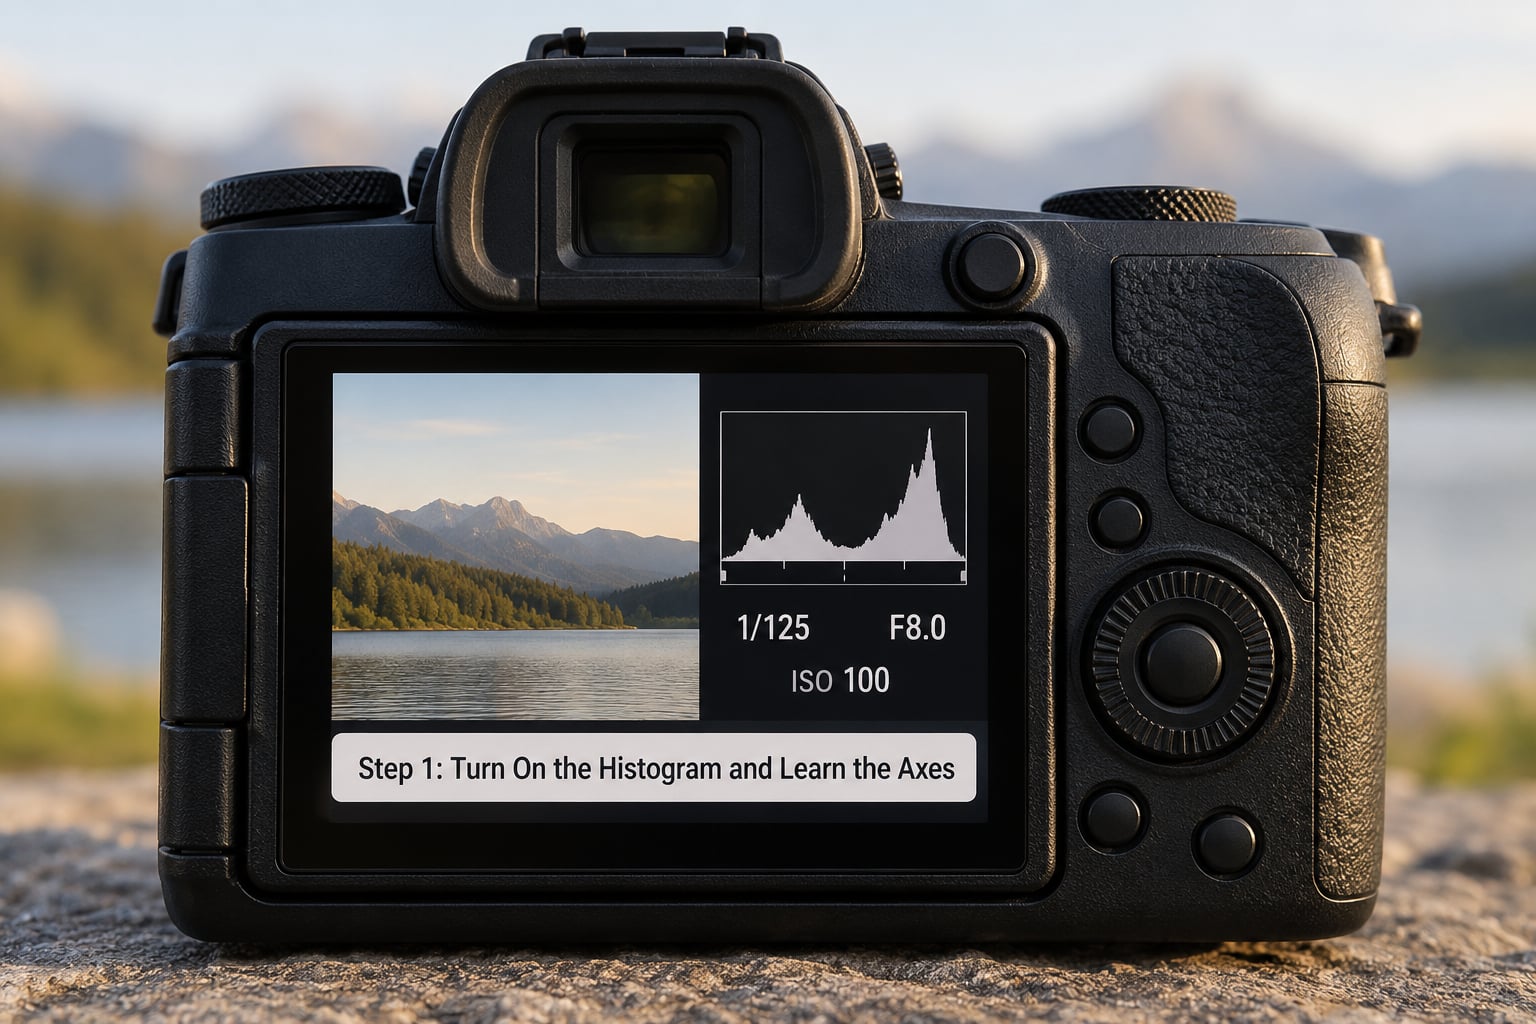
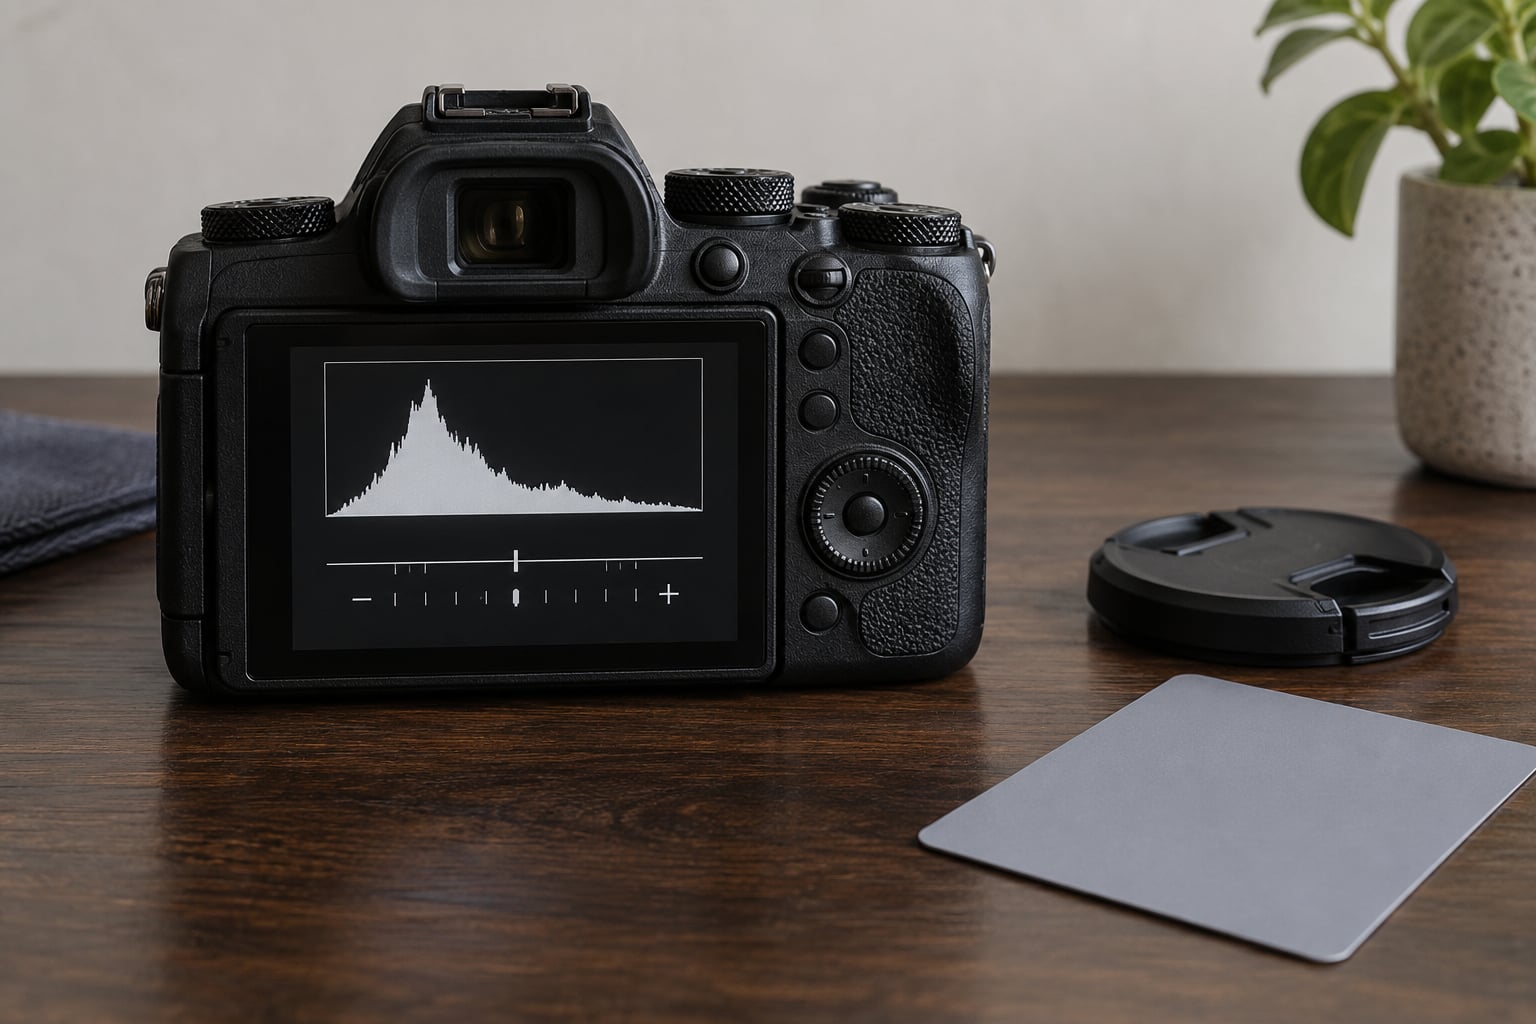
The graph runs horizontally from darkest to brightest and vertically by pixel count. The far edge on the dark side is pure black at zero, the far edge on the bright side is pure white, and the middle sits at 18 percent grey, which is what a standard grey card gives you.
Enabling it takes one menu dive, and the path differs by brand.
- Canon presses the DISP button repeatedly in live view until the histogram appears, or set it permanently under the shooting display options.
- Nikon uses the i button during live view and chooses the display mode, or adds the histogram through the custom shooting display menu.
- Sony finds it in the display or live view settings under the histogram grid options.
- Fujifilm places it in the screen setup menu, with a choice of RGB, luminance or both.
- iPhone and Android use a histogram app from your store, since the native camera has no live graph. Some newer phone cameras expose clipping warnings instead, which are worth learning too.
Step 2: Set Exposure Before You Read the Shape
Read the graph after the settings are sensible, never before. Aperture, shutter speed and ISO should be set in an order that suits the situation first: aperture for depth of field, shutter speed for movement, ISO last because it changes grain and dynamic range, not brightness distribution alone.
The histogram is an evaluation tool, not an autopilot. If the light is wrong and the graph says so, the answer is to move the light, not to compensate with exposure settings.
Step 3: Check the Edges for Clipping
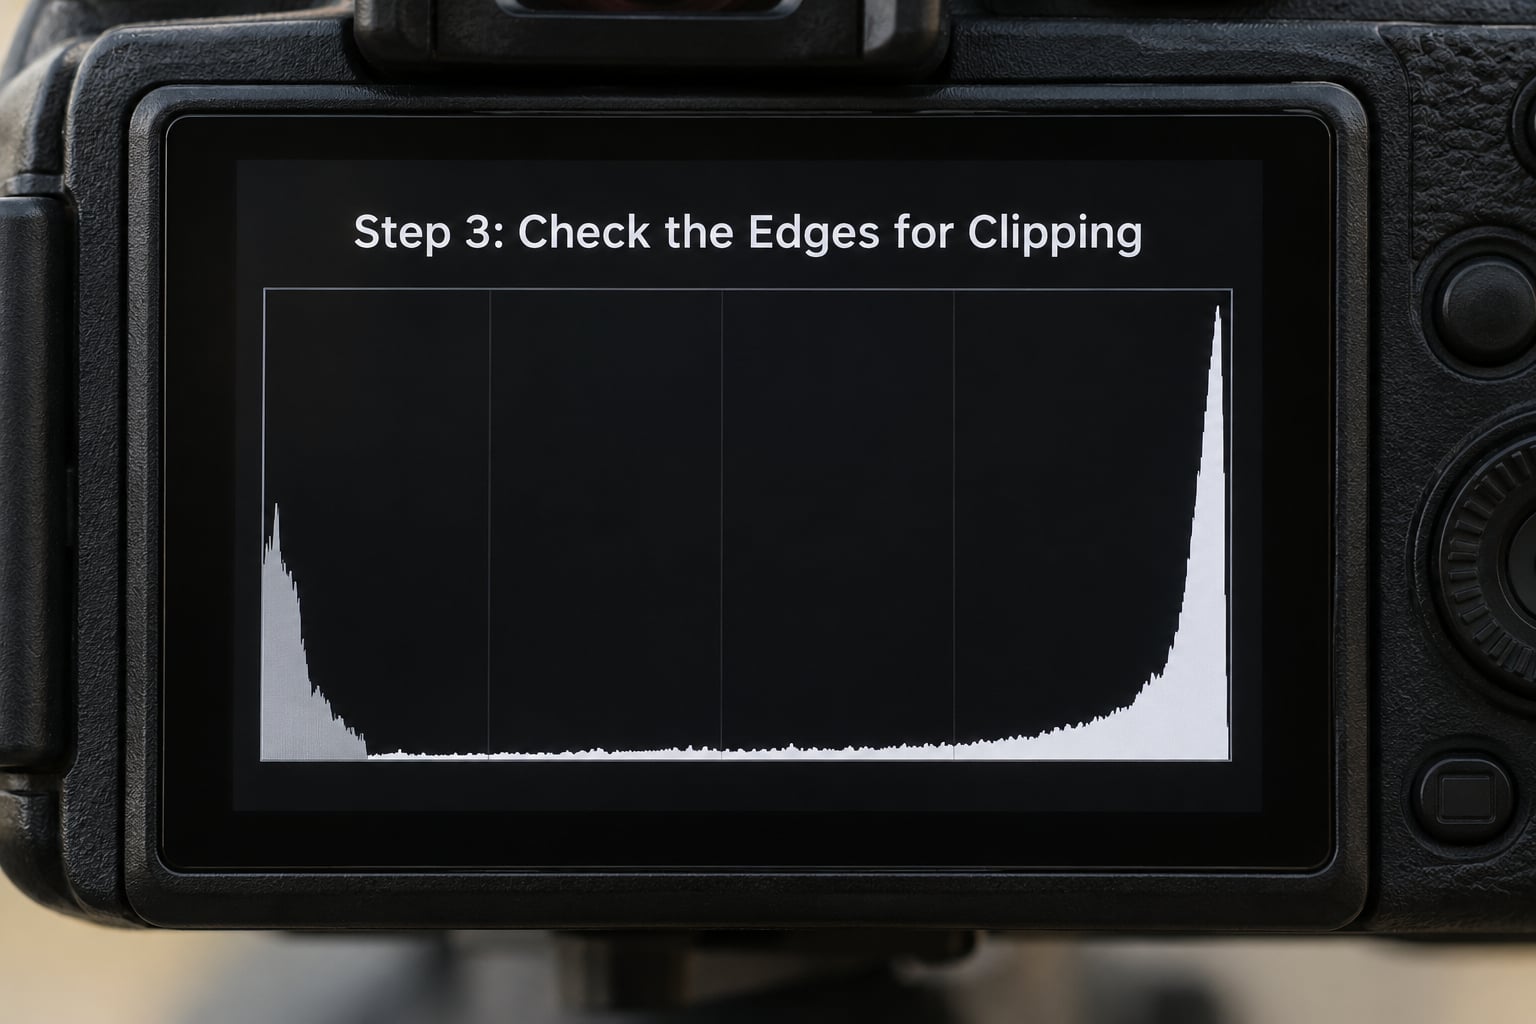
This is the only part of the read that is non-negotiable. Data piled against the bright edge means blown highlights. Data pressed against the dark edge means crushed blacks. Both are missing information that no amount of editing will bring back, which is why a clipped forehead stays flat and waxy no matter how far you drag a curve.
Turn on your camera’s blinkies or highlight alert at the same time. They flash the exact pixels that have clipped, and combined with the graph they answer the only question that matters: is the clipped area the background, or is it skin?
A small amount at either edge is often correct. A bright white seamless, a window, or a deliberately low-key frame will all push data to an edge on purpose. What you are hunting is a large, solid mass of pixels stuck at the far edge, especially if that mass is the face.
Step 4: Read the Shape Against Your Lighting
For portrait photography, a useful rule is that skin tones should land roughly 50 to 70 percent of the way along the axis for most lighting setups. Below that and faces go muddy; well past it and highlights start to shear off.
The overall shape then tells you what the light is doing.
- Left-weighted means a low-key look, or underexposure. Common with a single light on a dark background.
- Right-weighted means high-key work or overexposure. Common on a white seamless with a bright key.
- Broad and spread means wide tonal range, typical of window light and a black background.
- Narrow and tall means flat, low-contrast light. Often a white wall filling the frame with little else in it.
- Two humps usually means a bright background and a darker subject, which is fine and common.
Named lighting patterns leave their own signature. Rembrandt lighting gives you a broad midtone mass with a small bright cheek highlight and a dark side. Loop and butterfly sit higher on the curve because the face is lit from above. Split lighting spreads into two clumps. Backlight pushes the window or sky to the bright edge and leaves the face as a separate low hump, which is exactly when you raise exposure for the face and accept the background.
Step 5: Check the Face, Not Just the Graph
The graph describes the whole frame, so a perfectly shaped histogram can still hide a clipped forehead. Zoom to 100 percent in live view and look at the brightest part of the skin, typically the forehead, cheekbone and the bridge of the nose.
Then check the areas that break first: reflections in eyes, a highlight in hair, a bright shirt collar, and any specular shine from makeup or oil on skin. If the RGB histogram shows one channel pinned at the bright edge while the luminance graph looks healthy, that is coloured light or a coloured background, and the channel is where the detail is going.
Forum threads on photo.net and the Fujiforum keep returning to the same practical habit: work at exposure compensation zero, then nudge until the clipping indicator just stops blinking. Five seconds of that per frame beats a long inspection session afterwards.
Step 6: Refine and Confirm the Exposure
Make small adjustments and watch the graph move. One third of a stop at a time is usually plenty, and the shape will shift far less than you expect because most changes move the whole curve rather than one end.
Shoot RAW when you can. The in-camera histogram is based on the JPEG rendering, so it looks flat a little earlier than your RAW file actually clips, and a RAW file usually keeps a stop or two of highlight room that the graph does not show you. Brightening a RAW file recovers skin that the histogram said was gone.
Finish by confirming on the actual capture, not the live view. Turn on the playback histogram, check the face, and move on. In post, Lightroom and Capture One both show a scrolling histogram in the panels, which is useful for spotting a channel that clipped during processing.
Common Mistakes
Chasing a centred graph. A bell curve spanning the full width is a myth that circulates on photography forums and it causes real damage. A perfectly exposed low-key portrait has most of its data on the dark half and that is the intent, not an error.
Treating a bright-edge spike as automatic overexposure. A white seamless, a window or a high-key beauty shot puts data against the bright edge by design. Check whether the clipping indicator is flashing on skin or on the background before you change anything.
Trusting the LCD over the graph. Rear screen brightness is adjustable and the camera aims to make the image look correctly exposed on screen regardless of the real values. At anything other than bright daylight, believe the graph.
Reading the luminance graph when you need channels. Coloured gels, coloured seamless paper and mixed venue lighting clip one channel at a time. Switch to RGB when the light is not neutral.
Protecting the background and losing the face. Exposing for a bright window to keep the room balanced is a common habit from landscape work. In portraits the subject wins; the background can go dark and be lifted later.
Trying to fix exposure in editing. You cannot rebuild clipped skin texture, and raising shadows on a crushed frame only reveals noise and colour blotches. Correct it in the frame.
Two habits help more than any other trick. Check the graph after every single shot rather than at the end of a roll, and keep a grey card next to your subject once per session so your colour and exposure reference stays consistent.
Frequently Asked Questions
What should a histogram look like for portrait photography?
For a standard portrait, skin should sit roughly 50 to 70 percent along the axis, with a broad spread of tones across the middle. A low-key portrait is expected to sit on the darker half and a high-key one on the brighter half. What matters is not the shape but the edges: no solid mass of pixels stuck at either far end, especially where that mass is the face.
Does a histogram spike on the right mean my portrait is overexposed?
Not necessarily. A spike or pile against the bright edge can be a white seamless, a window, or a deliberate high-key frame, and those areas are meant to sit there. The question is whether the clipped pixels are skin. Turn on blinkies or highlight alert and check if the flashing pixels fall on the forehead, cheekbone or hair.
Should I aim for a centered histogram when taking portraits?
No. Centring the graph is the most common beginner mistake and it suits no particular look. A dark low-key portrait is supposed to sit on the darker side, a bright commercial frame is supposed to sit on the brighter side. Aim for a spread that gives you clean tones from the darkest shadow you want to keep through to the brightest highlight you want to keep.
Is a histogram more accurate than the camera exposure meter?
They measure different things. The meter reports a single suggested shutter speed for the metered area, while the histogram shows the real distribution of tones in the frame you just captured. The meter can be fooled by a bright shirt or a dark background, so set exposure from the meter as a starting point and verify the result on the histogram.
Why does my histogram look different from the histogram in Lightroom?
Your camera histogram is based on its own JPEG rendering and applies its own tone curve. Lightroom applies a profile, white balance and any default tone settings before it shows you a graph, so a file can look shifted or flatter on screen. Camera forum discussions about this are constant, and the answer is the same: judge capture with the camera graph and judge final output in the editor.
How do I use a histogram without losing detail in skin tones?
Turn on highlight alert, watch the graph after every frame, and stop nudging exposure when the clipping indicator just stops blinking. Shoot RAW so you keep recoverable highlight room, and check the brightest part of the face at 100 percent in live view, which is where a graph alone will not help you.
Conclusion
Set aperture, shutter speed and ISO in an order that suits the shot, then read the graph in the same sequence every time: dark edge, bright edge, where the face sits, how far the tones spread. Confirm it on the captured frame, because the face is what matters, not the shape of the graph.
On your next session, switch the histogram on before you set up the first shot and leave it visible. Five seconds per frame is the whole habit, and it is the difference between a retouch that rescues a file and a retouch that just brightens it.